Review


ptriex vector 6  (Addgene inc)


Bioz Verified Symbol Addgene inc is a verified supplier  
  • Logo
  • About
  • News
  • Press Release
  • Team
  • Advisors
  • Partners
  • Contact
  • Bioz Stars
  • Bioz vStars
  • 93

    Structured Review

    Addgene inc ptriex vector 6
    Ptriex Vector 6, supplied by Addgene inc, used in various techniques. Bioz Stars score: 93/100, based on 7 PubMed citations. ZERO BIAS - scores, article reviews, protocol conditions and more
    https://www.bioz.com/result/ptriex vector 6/product/Addgene inc
    Average 93 stars, based on 7 article reviews
    ptriex vector 6 - by Bioz Stars, 2026-05
    93/100 stars

    Images


    Similar Products

    93
    Addgene inc ptriex vector 6
    Ptriex Vector 6, supplied by Addgene inc, used in various techniques. Bioz Stars score: 93/100, based on 1 PubMed citations. ZERO BIAS - scores, article reviews, protocol conditions and more
    https://www.bioz.com/result/ptriex vector 6/product/Addgene inc
    Average 93 stars, based on 1 article reviews
    ptriex vector 6 - by Bioz Stars, 2026-05
    93/100 stars
      Buy from Supplier

    93
    Addgene inc piggybac vector ppbcag ntom20 moxbfp gs lov2 ires puro
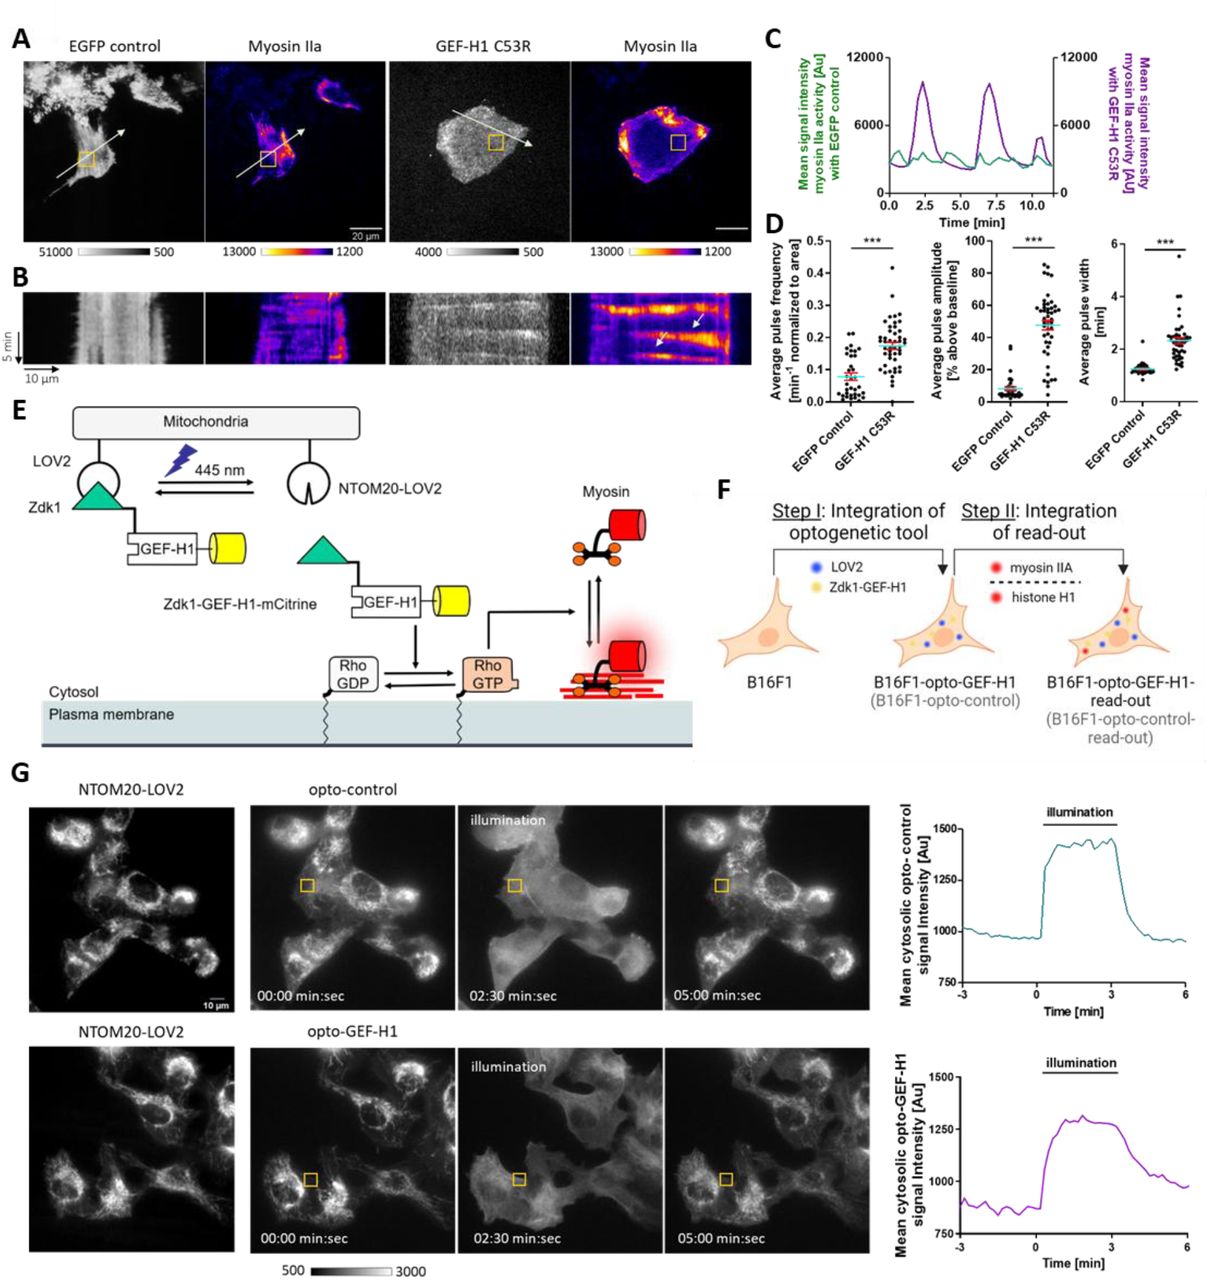
    (A-D) Increased expression of a constitutively active GEF-H1 mutant in B16F1 mouse melanoma cells leads to enhanced cell contraction dynamics. (A) Representative TIRF images of cells transiently expressing myosin IIa (pCMV-mCherry-MHC IIA) together with the constitutively active GEF-H1 C53R mutant (pCMV5-EGFP-GEF-HI C53R) or a control vector (pEGFP-N1), respectively. Scale bar = 20 μm. (B) Corresponding kymograph analysis along the arrows in A. (C) Myosin IIa signal intensity plots corresponding to the orange box in A. (D) Quantification of average contraction pulse frequency, amplitude and width. N=41 GEF-H1 C53R cells and N=24 control cells from 3 independent experiments, Error bars represent S.E.M., Unpaired t-test. (E) Schematic representation of optogenetic GEF-H1 release from the mitochondria into the cytosol and subsequent stimulation of cell contraction dynamics by myosin IIa. (F) Schematic representation of stepwise strategy to generate stable B16F1 cell lines expressing a GEF-H1-coupled optogenetic tool, the corresponding control and fluorescently tagged read-out proteins. (G) Left: Representative epifluorescence images showing the mitochondrial anchored photo-sensitive <t>LOV2</t> domain <t>(NTOM20-moxBFP-LOV2)</t> and opto-control (mCitrine-Zdk1), or opto-GEF-H1 (mCitrine-Zdk1-GEF-H1 C53R) before, during and after optogenetic stimulation at 445-488 nm. Scale bar = 10 μm. Right: Intensity plots of opto-control and opto-GEF-H1 signal corresponding to the orange boxes in left panels.
    Piggybac Vector Ppbcag Ntom20 Moxbfp Gs Lov2 Ires Puro, supplied by Addgene inc, used in various techniques. Bioz Stars score: 93/100, based on 1 PubMed citations. ZERO BIAS - scores, article reviews, protocol conditions and more
    https://www.bioz.com/result/piggybac vector ppbcag ntom20 moxbfp gs lov2 ires puro/product/Addgene inc
    Average 93 stars, based on 1 article reviews
    piggybac vector ppbcag ntom20 moxbfp gs lov2 ires puro - by Bioz Stars, 2026-05
    93/100 stars
      Buy from Supplier

    92
    Addgene inc lov2 vector
    (A-D) Increased expression of a constitutively active GEF-H1 mutant in B16F1 mouse melanoma cells leads to enhanced cell contraction dynamics. (A) Representative TIRF images of cells transiently expressing myosin IIa (pCMV-mCherry-MHC IIA) together with the constitutively active GEF-H1 C53R mutant (pCMV5-EGFP-GEF-HI C53R) or a control vector (pEGFP-N1), respectively. Scale bar = 20 μm. (B) Corresponding kymograph analysis along the arrows in A. (C) Myosin IIa signal intensity plots corresponding to the orange box in A. (D) Quantification of average contraction pulse frequency, amplitude and width. N=41 GEF-H1 C53R cells and N=24 control cells from 3 independent experiments, Error bars represent S.E.M., Unpaired t-test. (E) Schematic representation of optogenetic GEF-H1 release from the mitochondria into the cytosol and subsequent stimulation of cell contraction dynamics by myosin IIa. (F) Schematic representation of stepwise strategy to generate stable B16F1 cell lines expressing a GEF-H1-coupled optogenetic tool, the corresponding control and fluorescently tagged read-out proteins. (G) Left: Representative epifluorescence images showing the mitochondrial anchored photo-sensitive <t>LOV2</t> domain <t>(NTOM20-moxBFP-LOV2)</t> and opto-control (mCitrine-Zdk1), or opto-GEF-H1 (mCitrine-Zdk1-GEF-H1 C53R) before, during and after optogenetic stimulation at 445-488 nm. Scale bar = 10 μm. Right: Intensity plots of opto-control and opto-GEF-H1 signal corresponding to the orange boxes in left panels.
    Lov2 Vector, supplied by Addgene inc, used in various techniques. Bioz Stars score: 92/100, based on 1 PubMed citations. ZERO BIAS - scores, article reviews, protocol conditions and more
    https://www.bioz.com/result/lov2 vector/product/Addgene inc
    Average 92 stars, based on 1 article reviews
    lov2 vector - by Bioz Stars, 2026-05
    92/100 stars
      Buy from Supplier

    Image Search Results


    (A-D) Increased expression of a constitutively active GEF-H1 mutant in B16F1 mouse melanoma cells leads to enhanced cell contraction dynamics. (A) Representative TIRF images of cells transiently expressing myosin IIa (pCMV-mCherry-MHC IIA) together with the constitutively active GEF-H1 C53R mutant (pCMV5-EGFP-GEF-HI C53R) or a control vector (pEGFP-N1), respectively. Scale bar = 20 μm. (B) Corresponding kymograph analysis along the arrows in A. (C) Myosin IIa signal intensity plots corresponding to the orange box in A. (D) Quantification of average contraction pulse frequency, amplitude and width. N=41 GEF-H1 C53R cells and N=24 control cells from 3 independent experiments, Error bars represent S.E.M., Unpaired t-test. (E) Schematic representation of optogenetic GEF-H1 release from the mitochondria into the cytosol and subsequent stimulation of cell contraction dynamics by myosin IIa. (F) Schematic representation of stepwise strategy to generate stable B16F1 cell lines expressing a GEF-H1-coupled optogenetic tool, the corresponding control and fluorescently tagged read-out proteins. (G) Left: Representative epifluorescence images showing the mitochondrial anchored photo-sensitive LOV2 domain (NTOM20-moxBFP-LOV2) and opto-control (mCitrine-Zdk1), or opto-GEF-H1 (mCitrine-Zdk1-GEF-H1 C53R) before, during and after optogenetic stimulation at 445-488 nm. Scale bar = 10 μm. Right: Intensity plots of opto-control and opto-GEF-H1 signal corresponding to the orange boxes in left panels.

    Journal: bioRxiv

    Article Title: Optogenetic stimulation of Lbc GEF-mediated Rho activity dynamics promotes cell invasion

    doi: 10.1101/2025.03.28.646036

    Figure Lengend Snippet: (A-D) Increased expression of a constitutively active GEF-H1 mutant in B16F1 mouse melanoma cells leads to enhanced cell contraction dynamics. (A) Representative TIRF images of cells transiently expressing myosin IIa (pCMV-mCherry-MHC IIA) together with the constitutively active GEF-H1 C53R mutant (pCMV5-EGFP-GEF-HI C53R) or a control vector (pEGFP-N1), respectively. Scale bar = 20 μm. (B) Corresponding kymograph analysis along the arrows in A. (C) Myosin IIa signal intensity plots corresponding to the orange box in A. (D) Quantification of average contraction pulse frequency, amplitude and width. N=41 GEF-H1 C53R cells and N=24 control cells from 3 independent experiments, Error bars represent S.E.M., Unpaired t-test. (E) Schematic representation of optogenetic GEF-H1 release from the mitochondria into the cytosol and subsequent stimulation of cell contraction dynamics by myosin IIa. (F) Schematic representation of stepwise strategy to generate stable B16F1 cell lines expressing a GEF-H1-coupled optogenetic tool, the corresponding control and fluorescently tagged read-out proteins. (G) Left: Representative epifluorescence images showing the mitochondrial anchored photo-sensitive LOV2 domain (NTOM20-moxBFP-LOV2) and opto-control (mCitrine-Zdk1), or opto-GEF-H1 (mCitrine-Zdk1-GEF-H1 C53R) before, during and after optogenetic stimulation at 445-488 nm. Scale bar = 10 μm. Right: Intensity plots of opto-control and opto-GEF-H1 signal corresponding to the orange boxes in left panels.

    Article Snippet: To generate the PiggyBac vector pPBCAG-NTOM20-moxBFP-GS-LOV2-IRES-Puro for expression of the mitochondrial-targeted LOV2 domain, the fluorescent moxBFP tag (Addgene plasmid #68064; ) was amplified together with a GSGSGS linker sequence via PCR and inserted into pTriEx-NTOM20-mVenus-LOV2 (kind gift from Klaus Hahn, University of North Carolina, Chapel Hill, USA) using BamHI and BseRI restriction sites and Gibson assembly.

    Techniques: Expressing, Mutagenesis, Control, Plasmid Preparation